|
Main window displays current MyProxy state, current connections, working speed,
statistics and also lets you control the way software works. The window is
optimized to display the most important information and it takes as little
space as possible.
"Main" tab sheet "on the edge" statistics.
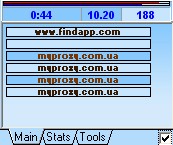
This sheet displays what's going on at the moment:
"0:44" -- adjustable indicator. Displays current modem internet
connection length in the current mode. It can display either Internet
connection time (global or current connection only) or traffic amount
(separate, global, or received).
"10.20" -- money spent (traffic and/or time).
"188" -- current modem connection speed.
There's a current connections window which you can see below
i.e. what the browser is currently requesting from the internet. Using the
right mouse button you can copy the request to the clipboard, left button --
cancel connection.
Checkbox in the lower right corner allows the window not to squeeze in
the "shortened" displaying mode.
"Stats" tab sheet -- Main statistics.
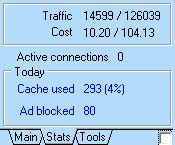
Statistics is displayed on this sheet.
"Traffic" -- traffic summary for today / beginning of the month.
"Cost" -- general costs, spent on internet today / beginning of the month.
"Connections" -- amount of currently active connections (connections
theirselves are displayed on the first sheet).
"From the cache" -- amount of information taken from the cache (in Kbytes)
and cache percent.
"Banners" -- amount of found and blocked banners.
"Tools" tab sheet -- MyProxy managing.
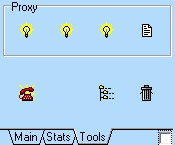
Most usable functions are gathered here:
1. Proxy turning on/off
2. Cache on/off
3. Filter on/off
4. Statistics display mode (day/month)
5. Dialing button
6. Cache view
7. Daily statistics reset
Main Pop-up menu.
Main Pop-up menu allows you having a quick access to most parameters and dialogs
of this program. You can easily turn on/off MyProxy, change caching mode and
banner cutting, open a dialer, statistics and cache dialogs.
|
